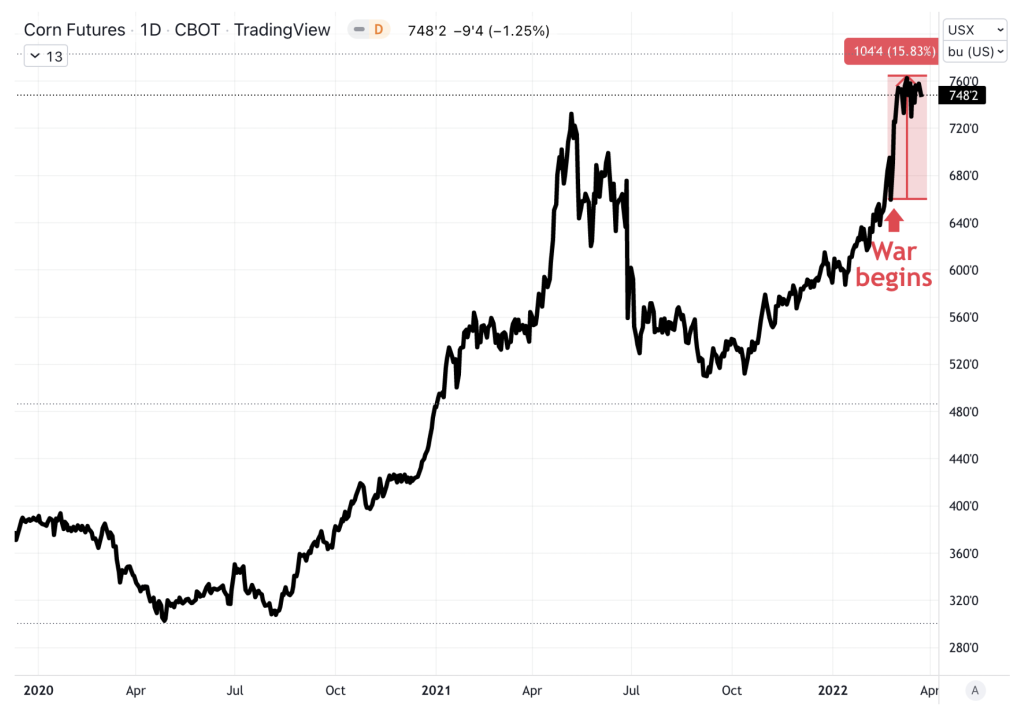
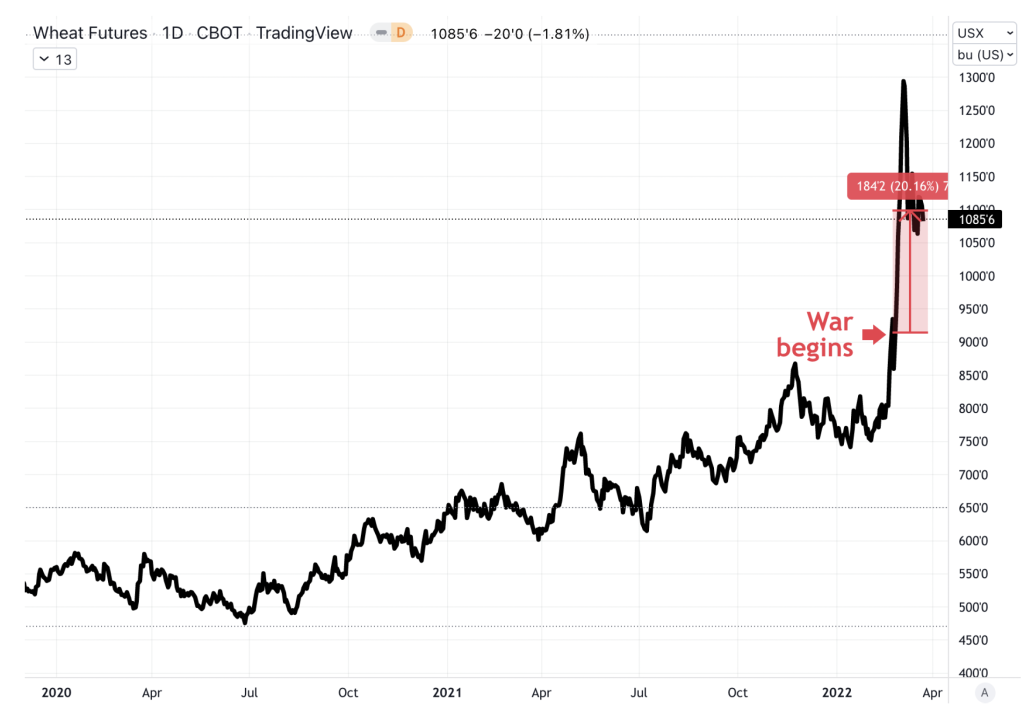
Immediate impact of the war: Global wheat and corn prices have jumped to, essentially, historic highs, reflecting the dire situation with supply that is already unfolding. Ukraine’s ports are currently blocked, which means that roughly a third of wheat volumes and close to half of corn volumes that were intended for shipment abroad remain stuck in domestic silos. Although it is Russia that attacked Ukraine, we think that the aggressor’s export volumes are also at risk, given that the country often curbs international trade in order to battle inflation, which is quickly accelerating in Russia as a result of western sanctions. It is also worth noting that the current supply shock is coming against a backdrop of the COVID-19 fallout, which has already affected prices to a significant degree.
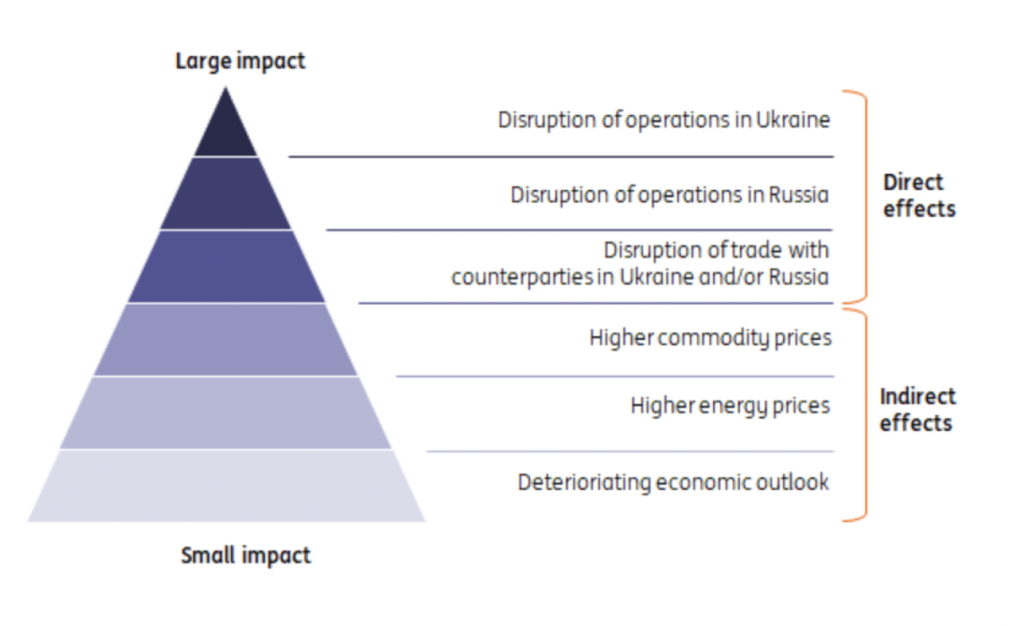
According to a recent UN FAO assessment (published in March 2022), even before the war, 44 countries globally were already in need of external assistance for food.
Further effects depend primarily on how quickly port infrastructure is unblocked and the size of Ukraine’s 2022 harvest. In our view, Ukraine is unlikely to be able to ship much agricultural produce via rail though its western border, which means that shipping routes must be restored for material exports to happen. Russian warships are currently patrolling Black Sea waters and will probably continue to do so until the war is over. Moreover, the country is facing very challenging spring planting conditions. Farmers are lacking funds for working capital (as they have been unable to sell a large portion of their 2021 crop) and fuel. They are also constantly threatened by military actions in locations that are in the vicinity of troop formations or supply lines. Depending on how the planting process unfolds harvest losses can reach 30-50% compared to last year, in our view. This means a scenario in which wheat exports do not occur at all (the entire production volume will go towards domestic consumption) is not out of the question.
Production and trade
Both Ukraine and Russia are large producers and even larger exporters of crops globally. During the 2021/2020 marketing year (i.e. last season) they were responsible for 27% and 15% of the global wheat and corn trade, respectively. In sunflower oil this share stood at 56%.

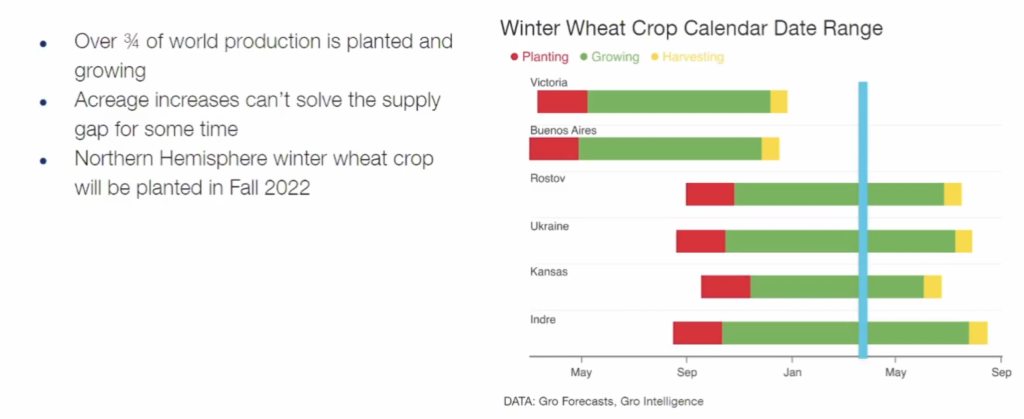
Production prospects for Russia and Ukraine winter wheat crops were favorable before the start of the war, as shown by Gro’s Black Sea Wheat Yield Forecast Model. That said, in the case of Ukraine this assessment has, in our view, come under threat due to brutal military action on its territory.
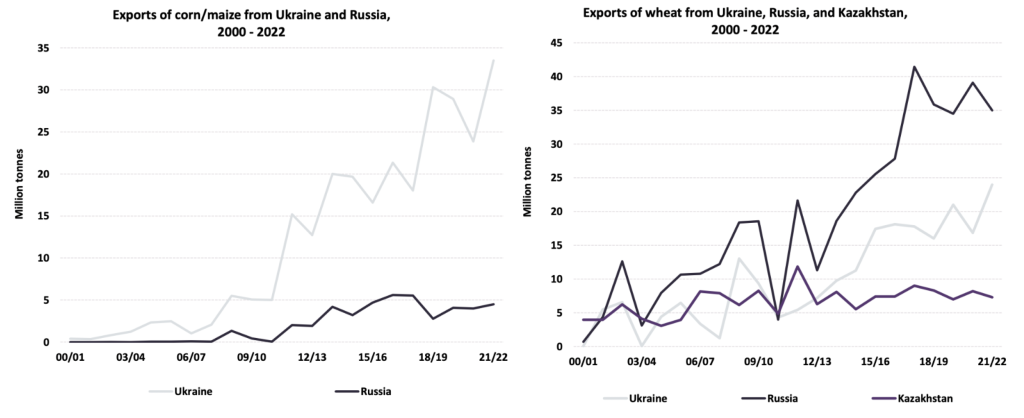
Before the conflict, Ukraine wheat exports were forecast at a record 24 million tonnes on a bumper crop and competitive prices. From July to December, Ukraine exports of wheat were up 27% from a year earlier. Corn exports rose 10% in the October-December period.
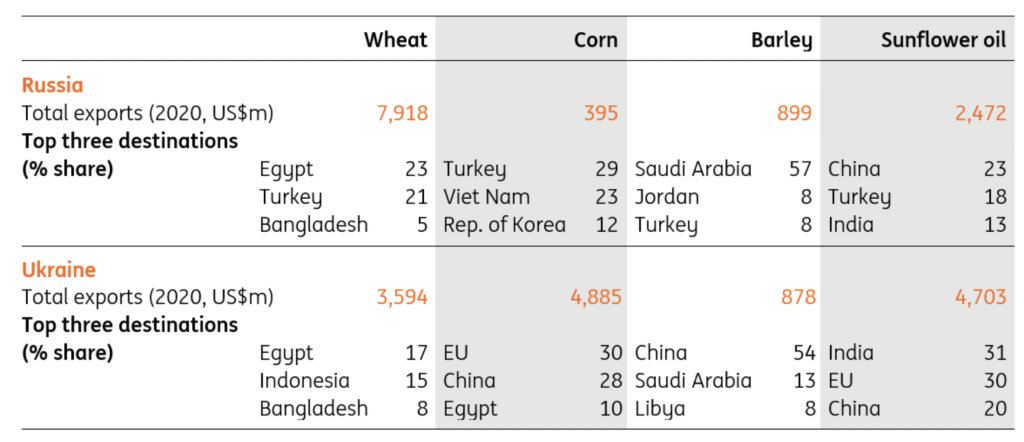
The Initial Impact on Black Sea Grain Exports
Global food supplies in coming months will largely be determined by crops that are currently growing, or soon to be planted. Other regions of the world will boost production and increase exports, especially of wheat. But these additional supplies won’t come near to offsetting the shortfalls from the Black Sea. The impact on global food supplies could extend well into 2023 if fertilizer prices remain high and supplies tight for a prolonged period, depressing crop yields and production.
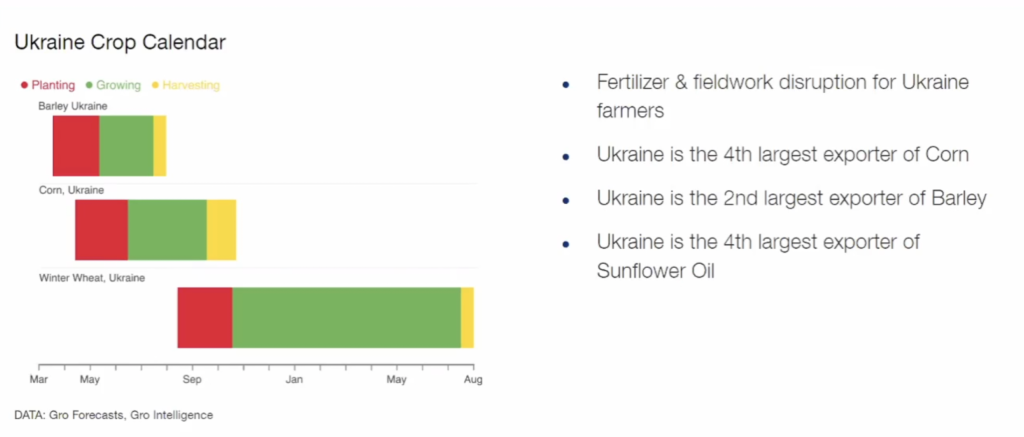
With many agricultural commodities already in short supply, replacing losses from stalled Black Sea shipments is a tall order for other major producers. For wheat, harvests have been positive in several major producing countries. But while exports will increase, there will not be enough additional supply to fill the gap from the Black Sea region. Before the conflict, Ukraine wheat exports were forecast at a record 24 million tonnes on a bumper crop and competitive prices.
The European Union collectively exports the largest amount of wheat. EU wheat production increased 10% this year. But the tightest inventories in 20 years will limit the bloc’s ability to expand exports this season beyond the previously forecasted 32.5 million tonnes.
- Australia is the third-largest wheat exporter, shipping 23.8 million tonnes last year. The country just finished harvesting a record wheat crop and as of March is forecast to increase exports by 15%.
- Argentina ranks No. 6 in wheat exports, and production from its latest crop rose 16%. Exports, about half of which go to Brazil and the rest to Southeast Asia, are projected to increase 22% to 14 million tonnes.
- India, despite being the second-biggest wheat producer, doesn’t normally export wheat except when harvests are good. The country is now headed for its sixth consecutive bumper crop, Gro’s model shows, and exports this year are expected to more than triple to 8.5 million tonnes.
- Global supplies won’t get much of a boost from the US hard red winter wheat crop, which could decline by a double-digit percentage because of drought, Gro’s model shows. In addition, comparatively high freight costs make the US a wheat exporter of last resort.
A strong winter wheat crop in China, would help world inventories. While China is the largest wheat producer, it is also the biggest importer, and a strong crop would reduce the country’s demand on international supplies. Yields are predicted to besimilar to the last season; key is the weather over April-May. China is a huge part of global demand. Any shortage means higher imports over the current and next seasons.
Further Grain Price Developments – Takeaways from Our Call with Gro Intelligence
Ukraine will be able to regain its market share quickly due to cost advantages in producing the crops and logistical advantages (over South America and India) in reaching the Middle East, North Africa, and Asia. How can the grain prices adjust to the war and weather dynamics?
● The currently elevated prices reflect a delicate equilibrium of demand and supply.
● A severe drought (typically 10%-20% of the lost crop in the Black Sea region) roughly
causes a 20%-30% increase in price – an approximate price hike amid the ongoing war.
In other words, the market thinks the war will be over in a couple of months, before the end of the marketing year in June 2022. If the war consequences extend and start impacting a June-July harvest, then it is like we have another drought warranting another +20% gain in price. Exports through western border estimated at 10%-15% of port capacity
- If ports will be closed by July 2022, when the new crops are to be harvested, the disruption becomes MUCH bigger.
In case of bad weather and poor harvest in other key locations (US, China), we can see an additional +20% increase in price levels.If the war resolves, the prices can decline by 20%.
Impact on Middle East and Africa
Middle East and North Africa are heavily reliant on imports from the Black Sea.
In Iran, the largest wheat producer in the Middle East, production is expected to fall 20% to 12 million tonnes this year, 17% below the 5-year average. Drought-stricken countries in the Middle East are expected to import record amounts of wheat this year. (Middle Eastern countries are heavily dependent on wheat imports, especially in years of low production.) Wheat comes mainly from the EU, Russia, Ukraine and Kazakhstan. Russia has already limited wheat exports to an export quota that runs from February 15 to the end of June 2022. Also in June 2021, Russia also introduced a floating wheat export tax rate, which limited annual grain exports. Projected wheat imports to the Middle East will increase by 38% to 24.6 million tons in 2022.
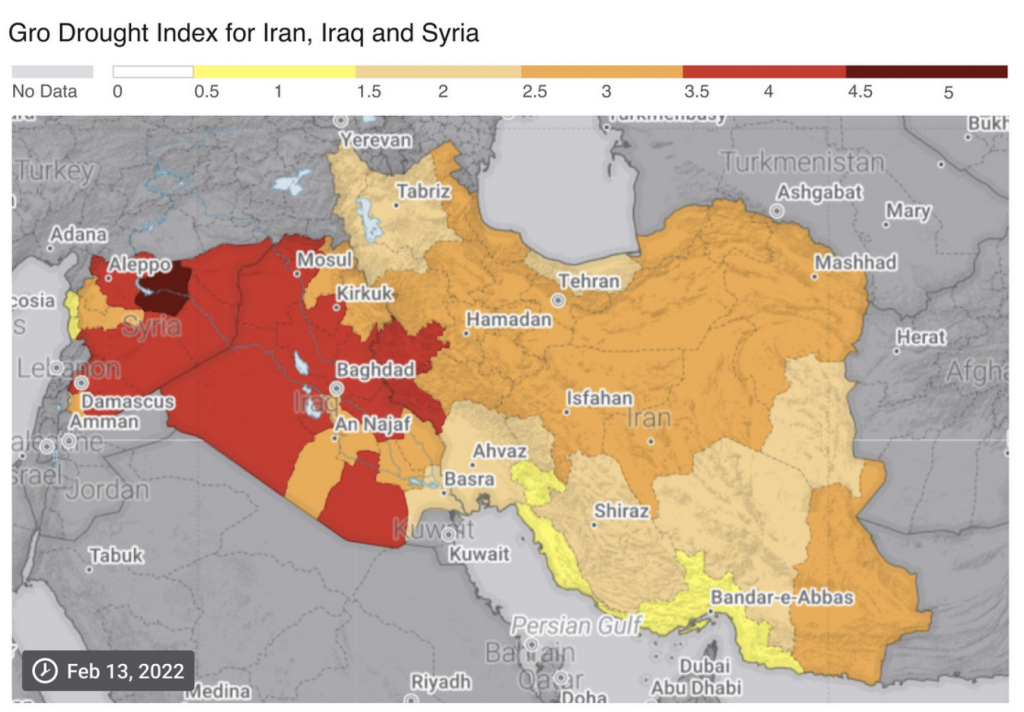
Vulnerable countries such as war-torn Yemen look set to suffer the most from Ukrainian food exports halting in the aftermath of the Russian invasion. “We get 50% of our grains out of the Ukraine-Russia area; it is going to have a dramatic impact on food costs, shipping costs, oil and fuel,” said the UN’s World Food Programme (WFP) executive director David Beasley in a social media video posted from Yemen.
Meanwhile, the countries of North Africa, the world’s largest region of wheat imports, also expect a sharp increase in grain imports due to the drought of domestic production. Any disruptions in exports from Ukraine or Russia will increase competition for wheat supplies, which have been the highest in recent years, from other major exporters, including the EU, Australia and North America.
Food inflation is now seen as a key catalyst for the Arab Spring protests — UN’s Food+ Ag Price Measure is already higher than it was in Dec. 2010. “This is the kind of stuff that leads to food riots,” Kona Haque at ED&F Man warns … “Bread riots” have been occurring regularly since the mid 1980s … The first protests of the Arab spring in Tunisia in December 2010 were quickly dismissed as another bout of bread riots. Arab regimes responded by making adjustments to food prices and offering more subsidies. Somalia, which imports wheat from Ukraine and Russia, is currently experiencing its worst drought in 40 years, with the region braced in the coming weeks to endure its fourth consecutive failed rainy season, putting around 28 million people at risk of facing severe hunger. Some parts of Somalia have not seen rain for over two years. With Somalia traditionally importing almost all of its wheat from Ukraine or Russia, the conflict is putting further strain on an already devastating food crisis. … Somalia is worried about the lack of attention the crisis in the Horn of Africa is receiving. “There are so many competing crises,” Ahmed told VICE World News, “and we are already seeing that the situation in Ukraine has diverted global attention. It is likely to overwhelm the agenda and donors at a critical time for Somalia.” … Almost every region in Somalia is affected by the drought, but the situation in the south of the country is particularly dire. In a camp for internally displaced people near the town of Luglow, workers there are struggling to provide enough food and water. Many people have been forced to walk for days to find sustenance after the drought has killed their farm animals and dried out their farmlands.
Impact on North and South America
Russia’s export ban on ammonium nitrate fertilizer, through March 31, will impact Brazil, the biggest buyer, just as the South American country is beginning to plant its big safrinha corn crop.
● Although the US doesn’t directly import Russian fertilizer, higher fertilizer prices will impact production costs as US farmers soon begin planting their spring crops. Fertilizer costs represent between 33% and 44% of total operating costs for US corn farmers.● “Dry conditions zapped as much as 40% of Western Canada’s grain output, and finding additional supplies to export would be a ‘struggle,’ said Phil Speiss, commodity futures broker for RBC Dominion Securities in Winnipeg, Manitoba. Stockpiles of wheat in Canada dwindled to 15.6 million tons at the end of December, down 38% from a year earlier, government data show.” Gro Intellligence’s Jim Heneghan said that as global supply tightens, US wheat farmers could export more product. “A lot of times, you’ll see the demand come back to the US … when you have global events that shut down exportable surpluses,” he said. “But it comes at a higher price.” That could be good news for US farmers, he added, but not for consumers. … The current situation “is just adding to additional food price inflation that we’ve been witnessing,” Heneghan said. “Over the next few months, you’ll see what food companies … will have to do with the higher prices they’re having to contend with,” Heneghan said. Food and consumer goods producers may choose to absorb some of the price hikes, but they are more likely to continue to pass them onto consumers, he noted. The producer price index, which tracks average price changes America’s producers get paid for their goods and services, rose 9.7% in the 12 months ended in January, not adjusted for seasonal swings, the Bureau of Labor Statistics reported in February.
Impact on the EU Countries
First EU and secondarily US wheat exports may be called upon to replace delayed Black Sea shipments. Major destinations for Ukraine corn, including China and the EU, will likely need to source more from the US, due to a weak outlook for South American production.
● Thus, EU countries will not only be affected by the halt in wheat imports from Ukraine and Russia, the meat and dairy industries are also poised to take a hit, as Ukrainian maize is essential for livestock feed, on top of the hike in prices caused by the reliance on Russian gas and fertilisers. In the case of maize, globally, only approximately 12% of maize is consumed for food, while approximately 60% is destined for livestock feed, explains Erin Collier, economist at the trade and markets division of the UN’s Food and Agriculture Organisation (FAO), speaking to Investment Monitor. “The countries that Ukraine exports the most maize to are China and those in the EU,” she adds. “Those countries have the capacity to import supplies from other countries,” she says, adding that problems will come if global supplies become tighter, as the hardest hit will be countries in Africa, “where maize is a food source, and they depend on imports”.● Higher energy prices are an indirect effect which is especially relevant for European food manufacturers. Data for the Netherlands shows that on average energy costs make up 1-3% of total costs in food manufacturing. But those figures are from 2019 and it is reasonable to assume that the current share is higher as wholesale energy prices have increased sharply since that time. On top of that, higher energy prices will also trickle down to food manufacturers through higher fuel costs and through their procurement because they buy a relatively large share of their inputs from more energy-intensive sectors such as agriculture and the packaging industry.
Historical Cases: Impact of Commodity Shocks onInflation
Another study that is somewhat related to ours is Neely and Rapach (2011). Using a dynamic latent factor model, they examine the role of world, regional, and idiosyncratic components in explaining international comovements in inflation rates across 64 countries. Their results show that world and regional components account for 35 percent and 16 percent of annual inflation variability, respectively. At the country level, they report that openness to trade, institutional quality, financial development, real GDP per capita, average inflation, inflation volatility and central bank independence are correlated with countries’ sensitivity to the world factor. If we define a feed grain price shock as a 20-percent or greater increase in annual average PPI’s of at least 2 of the 3 commodities, then the data indicate that feed grain price shocks occurred in 1973, 1974, 1988, and 1996. These sharp increases in feed grain prices each resulted in a surge in food inflation above the core rate of inflation, as measured by both the PPI and the CPI-U. Table 1 compares the aggregate PPI for food—finished consumer foods—to the PPI ‘core’—finished goods less food and energy. It also compares the aggregate CPI-U for food—food and beverages—with the CPI ‘core’—all items less food and energy. Combined with government policy responses, the 2010-11 food price spike tipped 8.3 million people (almost 1 percent of the world’s poor) into poverty.
● A rise in food prices increases headline consumer price inflation. For example, during the latest food price spikes, low-income countries (LIC) inflation more than doubled, from 7 to 15 percent during 2007-2008 and from 5 to 11 percent during 2010-2011. The increase in EMDE inflation was less pronounced, rising from 7 to 11 percent during 2007-2008 and from 5 to 6 percent during 2010-2011. Food prices accounted disproportionately for these increases in inflation—about two-thirds in – LICs countries and more than half in emerging market and developing economies (EMDEs).
On average, many of the poor in EMDEs and LICs are net buyers of food. As a result, food price spikes tend to raise poverty, reduce nutrition, and cut consumption of essential services such as education and health care. In extreme cases, food price spikes can lead to food insecurity and hunger, with severe adverse long-term impacts on human capital.● The movements of world and domestic staple food prices during the latest two food price spikes (2007-08 and 2010-11) resembled similar earlier episodes: world prices rose rapidly, while domestic prices rose only gradually. However, the 2010-11 spike was different from previous episodes in several aspects. The 2007-08 increase in food prices came after a long period of stability in food prices. In 2007-08, world prices of all staple foods increased steeply, led by rice.
Social and Ecological Effects
Social
Food and Agriculture Organization of the UN provided a simulation to determine the results of the reduction in food exports by Ukraine and Russia. The model illustrates
that the global number of undernourished people could increase by 8 to 13 million people in 2022/23. Apparently a food crisis would hit the Least Developed Countries most severely as the decrease of nourishment firstly is taking place in Asia-Pacific, followed by sub-Saharan Africa, and the Near East and North Africa.
● Previously conducted research on food security demonstrated an influence of food shortages on other social challenges: poor physical health, poor mental health, and weakening social institutions.
● Poverty in childhood increases serious long-term economic consequences, including higher health care expenditures, lower educational achievement (e.g., not completing high school and college), lost productivity and lower earnings in adulthood, and increased risk of poverty later in life.
Logistical
● Marine transportation is the main way to deliver Ukrainian wheat and corn to global consumers. Due to insecurity in Black Sea and Azov Sea ship insurers have quoted the additional premium rate at anywhere between 1% to 2% and up to 5% of insurance costs, from an estimated 0.025% before the war began, according to indicative rates from marine insurance sources.
● This additional risk would drive prices for Ukrainian agricultural exports up to 5%, assuming that transportation companies would accept the risk and allow the containers operate in a potential conflict zone.


