


The deterioration of macroeconomic indicators in Ukraine after 2014 has raised a debate about the actual level of military conflict’s impact on the economy of the state.
Despite numerous studies of the First and Second World Wars’ effect on national economies, modern local armed conflicts and civil wars have different specific features, tactics and intensity, affecting their economic consequences accordingly. As of today, some of the insights based on Latin America local conflicts in the 1980s are out-of-date and substantially differ from the impact of contemporary conflicts.
The hypotheses of the analysis were:
• the conflict duration affects the macroeconomic performance, reducing the negative effect in case of positional fighting or low-intensity collisions without significant destruction of the infrastructure;
• the intensity of hostilities and their localization in areas of economic activity is a key factor for negative changes in the economy;
• the impact on GDP, government expenditures, export-import indicators, household expenditures and domestic investment are the indicators that have similar dynamics, both in the context of inter-state armed conflicts and in civil wars;
• armed conflicts have a direct impact on consumer and household expenditures.
Gross domestic product.Collier (1999) has shown that the estimated cost of civil war in terms of declining economic growth (GDP) is 2.2% annually. According to Collier and Hoeffler’s study, the average civil war lasts 7 years. Thus, at the end of the war, the country’s economy will be 15% below the pre-war rate.
GDP is affected by the armed conflicteffects: the destruction of production capacity, infrastructure, transport, loss of land-use capacity due to shelling, mining, and pollution. Moreover, the departure of labor force from the territory of the country and the loss of civilians affect this indicator indirectly. Even in case of internal migration of labor from the armed conflict area to employment in a new place, the negative impact on GDP is maintained due to the destruction / shutdown or loss of control over the enterprises in the conflict zone. Thus, the internal migration in conflict area (refugees) increases employment in certain regions, but its negative impact on the national economy is retained as a result of job cuts within the state through casualties or emigration.
| Conflict | GDP / per person before,$ | GDP / per person after, $ | Changes,% | Changes yearly, % |
| Rwanda1990-1994 | 367 | 230 | -37,32 | -9,33 |
| Burundi1993-2005 | 184 | 144 | -21,73 | -1,8 |
| DRC1997-1999 | 212 | 64 | -69,81 | -34,9 |
| Guinea Bissau1998-1999 | 388 | 311 | -19,84 | -9,9 |
| Sierra Leone 1991-2002 | 214 | 150 | -29,91 | -2,7 |
| Mali 2012 | 739 | 715 | -3,24 | -3,2 |
| Libya2011 | 13400 | 6650 | -50,37 | -50,3 |
| Serbia1999 | 2441 | 870 | -64,35 | -64,3 |
| Tajikistan1992-1993 | 503 | 154 | -69,38 | -34,6 |
| Algeria1991-2002 | 2359 | 1743 | -26,11 | -2,37 |
| Chad2005-2010 | 586 | 736 | +15,59 | +3,12 |
| Iraq 2003 | 691 | 637 | -7,8 | -7,8 |
| Yemen1994 | 348 | 346 | -0,57 | -0,5 |
| Georgia2008 | 2900 | 2446 | -15,65 | -15,6 |
| Ukraine2014-2015 | 4030 | 2115 | -47,5 | -23,7 |
A comparative analysis of the majority of military conflicts (interstate and civil ones within 1990-2016 period) shows a clear decline in GDP per capita after the conflict is over. The dynamics of this decline range from 0.5% to 64.3%. Collier’s findings on 2.2% of GDP annual impact of armed conflict as an example of the GDP comparative model using GDP per capita are mostly not working. However, if the model considered isolates conflicts exceeding 5 years (Burundi, Sierra Leone, Algeria), an annual decline of 1.8-2.7% is close to Collier’s conclusion. It can be assumed that due to the duration of the armed conflict, the country’s economy adapts and compensates for the losses inherent in conflicts lasting up to 2 years. The GDP dynamics per capita for Ukraine in the first two years of the war is consistent with the general trend. It indicates that the economy of Ukraine per capita GDP may show growth not earlier than 2019 if the confrontation remains intensive.
An example of Angola illustrates this conclusion. Despite the fighting, the intensive mining of the territory (which still affects the farming), the dynamics of economic development showed a positive trend in line with changes in the activity of armed confrontation.
Attention should be drawn to the differences in estimates of armed conflict effect in different studies. For example, the annual impact of the Nicaraguan conflict is 15.4% in Fitzgerald’s (1987) study, different from that calculated in the Stewart, Huang & Wang 2000 study (0.8%) and Lopez 2001 – 90%. This discrepancy arose from the fact that different periods were taken as comparative basis. Thus, in the first case, the estimate was made by comparing GDP at the end of the conflict with the corresponding figure of 1980. In the second case – that of 1995, and in the third – that of 2000. A more logical approach is to compare the indicators one year before the conflict and the year the conflict ends in GDP per capita. This analysis allows us to take the demographic factor into account and reflect the impact of the confrontation on the national economy more accurately.
An analysis of five additional macroeconomic indicators for 14 conflicts of 1990-2012 shows similar trends. Against this background, the conflict in Chad differs significantly. The reason for this is that after the battle of N’Djamena in 2008, the war became positional without the use of aviation and heavy machinery. Localization of fighting in the area of the Chad-Sudan border allowed the Chad economy to adapt and show growth. This model can be applied to Ukraine in modeling the further behavior of its economy. If further drastic changes at the front are absent, the hostilities run on exclusively at the collision line, there is every reason to predict economic growth, which will accelerate due to the adaptation of business and economy to the situation in the conflict zone.
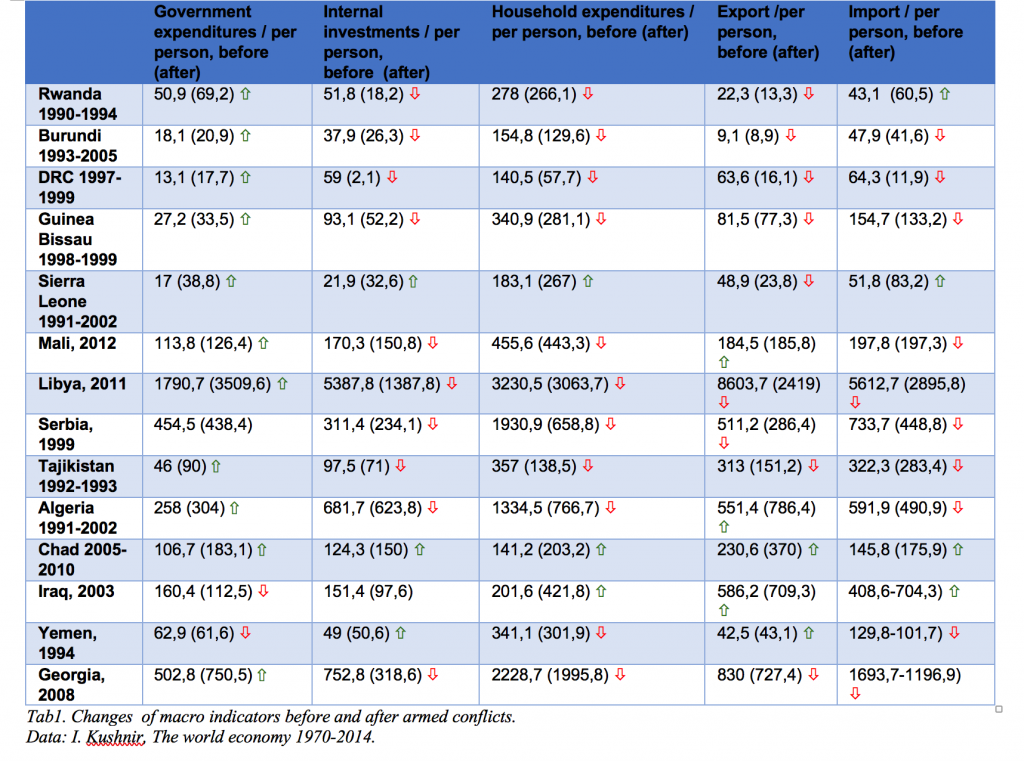
Government expenditures.In almost all cases (78%), armed conflicts led to an increase in government spending per capita. It stems from the fact that security and defense spending increases with the onset of armed confrontation, as well as the repair and rebuilding of war-torn infrastructure expenditures.
The comparative analysis shows the existence of exceptions, such as Serbia, where the indicator decreased during the conflict due to a population reduction of 0.3 million people and comprehensive international sanctions introduced in 1991 and lifted in 2001. But after the 1999 NATO operation, government spending has more than doubled. Therefore, the conflict in Serbia still led to an increase in government spending, but after the lifting of sanctions.
A similar pattern can beillustrated by the example of Iraq, where comprehensive international sanctions were imposed in 1990 and lifted in 2003. Serbia and Iraq are the only countries showing a reduction in government spending during the conflict. This effect works only when comprehensive sanctions are imposed and does not work when sanctions are imposed on arms delivery, entry restrictions or asset freezing. Thus, the moderating effect of sanction pressure on government spending, while not in doubt, is compounded by an increase in this figure as soon as such sanctions are lifted.

Internal and external investments. The armed conflict is affecting both domestic and foreign investors. Depending on the intensity of the conflict, they withdraw capital abroad or transfer production facilities to other regions of the country. The factor of capital withdrawal remains relevant in both scenarios of domestic investors’ behavior, as the ability to save capital in a climate of fluctuation and uncertainty of the future national market. Moreover, the greater the likelihood of the war zone and / or external aggression expansion, the greater the insurance of investment capital abroad.
Domestic investment is one of the most sensitive indicators as for armed conflict. The commencement of armed clashes has a negative impact on both financial and real investment. This is because the stock and securities markets in the conflict country respond to the conflict instantly, and the investment in capital construction is suspended due to high risks, especially if such investment objects are in the combat zone. At the same time, investors refrain from investing in the development of production due to uncertainty in the future.
The increase in domestic investment in Sierra Leone (Table 2) is driven by the conflict longevity, having allowed the economy to adapt to it. The level of domestic investment decreased from $ 24.3 to $ 18.9 per capita in the first year of the conflict in this country. Subsequently, this indicator was characterized by high volatility, peaking at $ 32.6 in 1996 and falling to a historical low of $ 7.8 in 1999. Such significant and frequent fluctuations most likely come from frequent changes in operational and political conditions, the intensity of hostilities, and changes in the country’s political leadership.
In Chad, the territorial concentration of hostilities did not affect basic investment and economic activity regions. In the Yemeni conflict, the unification of northern and southern Yemen with the elimination of the socialist economy in the south has provided a strong impetus for the development of the united country’s economy. The transition to a capitalist form of social order had such a strong effect that the civil war (April – July 1994) did not significantly affect the volume of domestic investment. The political changes that took place after the suppression of the south in the III-IV quarters of 1994, the liquidation of the socialist party made it possible to promote access to investment projects and objects. This is the reason why the Yemeni case differs from the general tendency of the internal investment quote reduction as a result of armed conflicts.
The loss of 1,000 people in a conflict leads to a decrease in investment by 0.0001% next year, the results of the Warfare, Civil Conflict and Spatial Impacts on Domestic Investment: Evidence from South America, 1950-2000 (Michael Hicks, Ph.D. Bureau of Business Research and Economics at Ball State University Muncie, Indiana) show. Our analysis of 14 conflicts within 1990-2012 period, presented here, shows a much greater impact of armed confrontation on investment performance. For example, in Mali, the fall in domestic investment was 11% the following year after the conflict was over, in Tajikistan – 27.1%, in Georgia – 57.6%. The results may differ from the study of conflicts in South America in 1950-2000 due to the following factors:
• the conditions of local infrastructure and facilities development for capital investment, their location;
• the destruction facilities’ development that affects the number of losses;
• regional differences in national economies and their export and industrial capacities, which affect investment attractiveness;
• the conditions and development of the stock and securities markets.
However, the examples above provide a direct link between armed conflict and a decline in domestic investment. The negative impact on domestic investment increases in view of the occupation or seizure of a certain territory, thus breaking economic and investment ties between territories within a single country and is reflected in national statistics. This is especially noticeable when direct investors find themselves in occupied or conflict area and are forced to cease investment activity or change its geography. At the same time, when the investor remains in the government-controlled territory, the negative effect is significantly reduced as there is a change in investment objects or geography within the country and the funds continue to be recognized in national domestic investment statistics.
The behavior of external investors is a far cry from the behavior of internal ones, so does the FDI response. Inter-state conflicts and wars lead to a reduction in investment that is twice the effect of civil conflict, Michael Hicks argues in his findings. However, the analysis shows that armed confrontation does not lead to investment curtailing in some cases. Based on the analysis, we can conclude that, as a rule, the reduction in FDI inflows occurs the year after the conflict. It is in the first year of confrontation that the prospects of the market, the activity of the parties, the safety of business functioning, the possibilities for its physical security assurances are evaluated.
Internal and external conflicts are always at risk of being transferred to neighboring countries. Even if the civil war is solely the result of internal processes, national investors may fear that the war will spread to its neighbors. As a result, investors often resort to withdrawing their investments from both the warring country and neighboring countries.
Murdoch and Sandler’s study (2002) concludes that civil wars undermine short-term growth significantly, both in the war country and in neighboring countries. This negative impact is very sizable and in major conflicts, in terms of casualties, the reduction in investment is about one-third of the investment during the whole conflict.
Such findings correlate to Li’s study (2006), who proved that civil wars affect both the likelihood of FDI inflows and its amount. However, interstate conflicts, by contrast, affect just the likelihood, but not the amount of foreign direct investment. At the same time, terrorism affects neither the likelihood nor the extent of it.
Resource mobilization as a result of defense spending makes domestic and foreign investment more attractive, Gupta noted in a study of the defense spending impact in the long run. Such a conclusion is not relevant to aggression-related defense expenditures.
There are 2 scenarios that do not include the devastating effect of the conflict, where the level of investment in conflicting countries will decrease. In the first case, it happens amid declining government revenue. As long as citizens interpret the conflict as temporary, they will spend money on consumer purposes, reducing the amount of capital that can be invested. In the second case, private investors fear the risk of a deteriorating security situation and switch to other attractive opportunities that offer a higher security level.
In any case, one could argue that local conflicts can partially affect the investment availability if:
• the investor is able to protect the investments physically in the conflict territory;
• investments are directed to an area not covered by armed conflict and can be protected physically if the conflict zone is extended;
• there are positive changes in the investment climate amid the armed conflict (for example, the government becomes loyal or has let Western investors in, reforms are underway, the dictatorship or corruption regime is overthrown, etc.). Using the example of Ukraine, we see that despite the decrease in investments in 2014 (a consistent decrease has occurred since 2012), the FDI increased from $ 0.85 to $ 3.05 billion in 2015.
National currency.Armed conflicts affect the national currency. All analyzed cases prove that, except the case of Chad. In most cases, the depreciation of the national currency was significant. For example, the highest indicators of the national currency devaluation in the first year of the conflict were in Sierra Leone (92.8%), Algeria (92.3%), Serbia (83.7%), Rwanda (76.9%), Burundi (77.6%), Yemen (70 %). The lowest rates were recorded in Mali (7.6%), Libya (11.9%), Georgia (10.8%) and the DR Congo (13.2%). Ukraine showed a devaluation of 63.4%, which is lower than the five countries leading the fall in the national currency, in the first year of the conflict.
The devaluation effect of armed conflict is caused by a complex of reasons considered in this study: the destruction of infrastructure, exportsand FDI reduction, capital outflow, including the banking one, thus leading to a shortage in the currency market, as well as trade blockades or severance of trade and economic ties in cases of interstate conflicts.
Thus, the national currency devaluation is one of the permanent consequences of armed conflict, regardless of the effect on all other macroeconomic indicators analyzed in this study. In most cases, the devaluation is limited to a period of 1-3 years after the end of the conflict, except for the cases where armed conflict leads to significant destruction of infrastructure, loss of parts of the territory with stable economic ties or significant casualties. The case of Ukraine is an example of the complex influence of factors inherent in the interstate conflict: partial occupation of the territory, loss of export markets of a neighboring country, capital outflow. The more vulnerable the effects of the conflict on the state’s economy system, the longer the national currency’s devaluation will continue over time, the analysis proves.
Accordingly, inference should be drawn that the armed conflict impact on the national currency devaluation in the conflict country depends on how devastating the conflict is to the state’s economic system, how quickly its effects can be overcome or offset, for example, at the expense of other markets.
External debt indicators.The insights indicate that military conflict affects the external debt ratio. This impact comes from the foreign capital outflow from the country where the war is conducted because of investment risks, as well as the need for borrowing that targets both defense spending and infrastructure recovery after hostilities. In addition to the foreign capital outflow, armed conflict undermines the willingness of foreign capital to invest.
The insights prove there is an increase in external sovereign debt in the first year of the conflict. However, further, this indicator behaves differently and is most likely determined by the impact of the conflict on the economy, the volume of investments and external assistance to the state affected by the conflict, as well as the duration of the conflict and the intensity of the confrontation.
In addition, armed conflict in many cases leads to a reduction in assistance programs development, which requires offsetting needs by increasing sovereign borrowing.
Household expenditures.The analysis shows that armed conflicts lead to a household spending reduction in almost 80% of the cases examined. This figure is closely related to the trend of consumer spending reductions by virtue of such conflicts.
The key factors behind such changes are:
• households’ rundown, both through the infrastructure destruction and through refugees and internally displaced persons who either leave the country or settle apart in such a way that they do not create new households (for example, in refugee camps or at relatives’ homes). Household spending cuts can also be triggered by job cuts, both in view of the business infrastructure destruction and the investment outflow. Fighting leads to a reduction in the number of households and, consequently, in consumption. Consumer expenditures are generated by households’ current consumption expenditures, durable consumption expenditures, and services expenditures. The analysis suggests that, in armed conflicts, reduced consumer spending leads to a reduction in household spending on current consumption and services. Depending on the intensity of the conflict, the area covered, the general level of the population affluence and ethnic specificity, the conflict may affect durable goods spending differently. The poorer the society, the greater the impact of the conflict on reducing such expenditures. At the same time, in some cases, such as in Ukraine, persons who have left the territory not controlled by Ukraine in view of risks and needs have increased the costs of such goods. Given the negative impact of armed conflict on inflation and the national currency, it can also facilitate temporary increased spending on durable goods as a means of securitizing the savings under high risk.
• In most cases, especially in poor countries, armed conflicts lead to a reduction in this macro indicator. For example, the 1992-1993 armed conflict in Tajikistan led not only to a reduction in household spending but also to a reduction in consumer spending from $ 346 per capita to $ 144.9 (-51.8%). Although the trend has been decreasing in Tajikistan since 1991, the insights of other cases show that there is a correlation between armed conflict and a reduction in consumer spending. For example, the conflict in the DR Congo led to a fall in consumer spending from $ 200 per capita in 1997 to $ 61.8 in 1999 (-69.1%). It should also be noted that in many cases, reducing consumer spending was one of the factors leading to the onset of armed conflict and therefore preceded the conflict. Thus, it can be concluded that, despite whether the reduction in consumer spending triggers a conflict or is its consequence, this indicator accompanies the armed confrontation.
Export.Armed conflicts have affected exports in most of the cases analyzed. This comes from the destruction of export capacities, the cross-border restriction on the movement of goods (in interstate conflicts), the trade blockade, and the sanctions imposed. However, contrary to the general trend, one can see an atypical situation with export indicators in the Mali conflict, due to the fact that the country’s export facilities were at a considerable distance from the war zone (in the south) and the conflict zone itself was free of significant infrastructure.
Export performance in long-term armed conflicts shows that the negative effect is relevant to commodity economies only during the first 2 years. After that, the export sectors adapt to the upward trend. Algeria, where exports declined, with the onset of the armed conflict, by 11.8% in the first and by 16.7% in the second, demonstrating growth afterwards, could be an example. The dynamics changed over the years, according to the situation at the fields: from -20.5% in 1998 to 56.4% in 2000.
A similar pattern can be seen in the example of the Second Civil War in Chad, where the fighting outbreaks in the export capacity zone in 2007 and 2009 affected export performance, which showed a decrease of -4.1% and 12.8%, respectively.
Thus, armed conflicts do not undermine export performance if only:
– combat clashes occur at a considerable distance from the export facilities’ concentration zone;
– the armed conflict lasts for a long time and the export capacity has the ability to adapt to war.
These findings are typical for Iraq as well. The increase in per capita exports is driven by rising oil prices after the coalition invasion starts. However, if we estimate export volumes for 2003 at constant 1970 prices, we will see an 11.8% reduction in exports. This means that the increase in export performance in this case was driven by rising energy prices since the coalition operation had started in Iraq.
Imports.71% of conflicts analyzed show a correlation between armed confrontation and declining import performance. In most cases, the decline in imports is caused by a fall in consumer demand and a decrease in population’s purchasing power. The national currency devaluation, usually accompanying armed conflict, leads to a surge in inflation, primarily of foreign origin. Thus, a decrease in population’s purchasing power, household expenditures, consumer demand against the background of rising prices for imported goods leads to a decrease in imports, which was felt in 2015 in Ukraine. As a rule, the population focused on consumption of imported products represents the middle class and affluent social groups, the most sensitive to armed conflict. They are the first to leave the war zone, moving to other regions (Donbass) or emigrating to other countries (Syria, Libya). Thus, the exit of the middle class, as a consumer of imported products, from the conflict country contributes to a decrease in demand for imported goods and services as well.
The cycle effect of conflict.In most cases, based on world experience, poverty triggers conflict. It is a motivation for many people to take an active part in hostilities and to use armed conflict as a means of earning money. Armed conflict by virtue of the infrastructure destruction, casualties among the military and the civilian population (loss of breadwinners), the emergence of refugees and internally displaced persons, contributes to the poverty rise. Thus, there is some cyclicality in poverty’s impact on conflict uprising, as well as poverty rise resulting from the conflict.
Conclusions.The dynamics of macro indicators in Ukraine after 2014 follows the general trends in national economy’s behavior in response to armed conflict.
At the same time, the specifics of the armed conflict within the territory of Ukraine, with all the signs of an interstate conflict, when one of the states uses and supports the armed forces in the territory of another state, allows for the conclusions about possible increase in Ukraine’s FDI inflows. The export indicators as of 2016 are atypical, since the second half of 2016 was expected to see an increase in exports.
The impact of armed conflict can be overcome through economic reforms with an improved investment climate and the level of investment and property rights protection. The government should pay attention to the risks of post-conflict trade imbalances: when imports show an increase and exports fall (the Sierra Leone and Rwanda case), as shown by Ukrainian statistics in 2016.
References:
1. (Collier, Paul. 1999. “On the Economic Consequences of Civil War.” Oxford Economic Paper 51 (1): 168–183.)
2. Fitzgerald, E. V. K. 1987. “An Evaluation of the Economic Costs to Nicaragua of U.S. Aggression: 1980-1984,” in The political economy of revolutionary Nicaragua. Rose J. Spalding ed. Boston, Mass.: Allen & Unwin, pp. 195-213. Lopez, Humberto. 2001. The cost of armed conflict in Central America. Mimeo. World Bank: Washington D.C.
3. Michael Hicks, Major Jeffrey S Smith. “Warfare, Civil Conflict and the Spatial Impacts on Domestic Investment: Evidence from South America, 1950-2000”, Bureau of Business Research and Department of Economics Ball State University Muncie, Indiana
4. Gupta, Sanjeev, Benedict Clements, Rina Bhattacharya and Shamit Chakravarti (2004) “Fiscal consequences of armed conflict and terrorism in low- and middle-income countries” European Journal of Political Economy vol. 20 pp 403-421.
5. Murdoch, James C. Todd Sandler (2002) “Economic Growth, Civil Wars, and Spatial Spillovers” Journal of Conflict Resolution 46(1) pp 91 – 110.
6. Murdoch, James C. Todd Sandler (2002) “Economic Growth, Civil Wars, and Spatial Spillovers” Journal of Conflict Resolution 46(1) pp 91 – 110.
7. Stewart, Frances, Cindy Huang, and Michael Wang. 2000. “Internal Wars: An Empirical Overview of the Economic and Social Consequences,” pp. 67-103 in War and Underdevelopment – Volume 1: The Economic and Social Consequences of Conflict. Frances Stewart and Valpy Fitzgerald eds. Oxford: Oxford University Press.